




Data Analyst
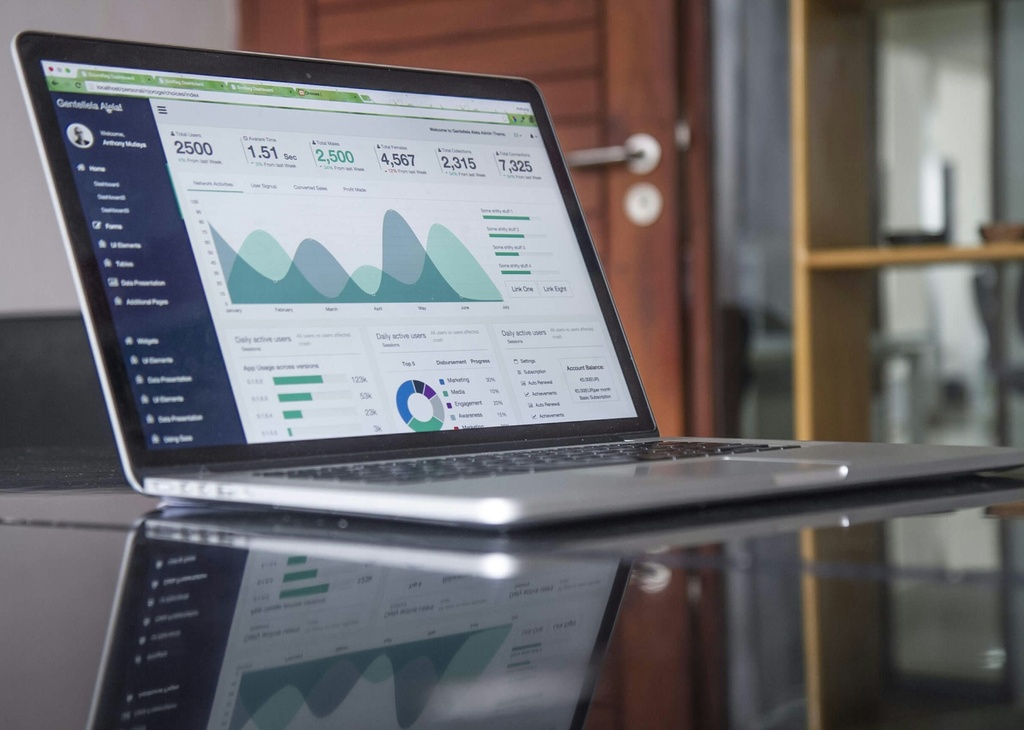
<p>Figures that differ depending on the tool consulted, Excel reports rebuilt by hand every month, KPIs nobody knows how to recalculate, decisions made without visibility on margins or trends: in many companies, the data exists but cannot be used. Making it useful requires understanding the business questions, making sources reliable, building consistent indicators and presenting results in a form decision-makers can read.</p><p><strong>Here is what a Data Analyst from MySpecialist can take on:</strong></p><ul><li><strong>Requirements gathering and scoping</strong>: identifying business questions, the decisions to support and the indicators that matter for management, sales, marketing, finance or operations.</li><li><strong>Data collection and consolidation</strong>: extracting data from the ERP, CRM, accounting software, e-commerce platform, Google Analytics or internal files, and combining sources into a consistent model.</li><li><strong>Data cleaning and validation</strong>: detecting duplicates, missing values, inconsistencies and input errors, and documenting the correction rules applied.</li><li><strong>KPI definition</strong>: formalising indicators, how they are calculated, their scope and update frequency so that everyone reads the same figures.</li><li><strong>Queries and data modelling</strong>: writing SQL queries, preparing datasets and building data models suited to reporting and analysis.</li><li><strong>Dashboards</strong>: designing dashboards in Power BI, Looker Studio, Tableau or Metabase, with filters, drill-downs and visualisations tailored to each audience.</li><li><strong>Ad hoc analysis</strong>: profitability by product, customer or channel, sales, churn, inventory or campaign effectiveness analysis, with actionable conclusions.</li><li><strong>Variance and anomaly analysis</strong>: identifying unusual fluctuations, comparing budget and actuals, and investigating the causes behind observed trends.</li><li><strong>Reporting automation</strong>: replacing manual spreadsheets with automatically refreshed reports using advanced Excel, Power Query, Python or available connectors.</li><li><strong>Presentation and synthesis</strong>: presenting findings as notes, charts and recommendations that non-technical stakeholders can understand.</li><li><strong>Documentation and maintenance</strong>: documenting sources, calculations and reports, monitoring that they run correctly and adapting them as tools or needs change.</li></ul><p>The Data Analyst can set up a first reliable reporting layer in an SME still running on spreadsheets, or strengthen an existing data team on recurring analysis, a visualisation tool migration or a KPI structuring project.</p><div class="faq" style="display:none;"><h3>Frequently asked questions</h3><ul><li><strong>Why work with a data analyst?</strong> To turn company data into reliable indicators, dashboards and analysis that support decision-making.</li><li><strong>Can this professional work with scattered or poorly structured data?</strong> Yes, particularly when data comes from several tools and needs to be cleaned, reconciled and documented.</li><li><strong>Is the scope limited to the items listed?</strong> No, it can be adapted to other needs related to data analysis, reporting and performance management.</li></ul></div>